
Data Analytics Course in Whitefield
Build a strong career in Data Analytics with ScholarLogic’s industry-oriented Data Analytics Course in Whitefield. This course is designed to help you learn essential analytics tools, work on real-time datasets, and gain practical experience through hands-on projects. You’ll be trained by experienced data professionals who guide you step-by-step through statistics, Excel, SQL, Python, data visualisation, dashboards, and advanced analytical techniques used in the industry


Trusted by 1000+ learns and
hiring partners across India
15+ Hours of Immersive
Practical Training at Scholarlogic
Interactive sessions by
Working professional of ScholarLogic.
An industry-leading
Certificate by ScholarLogic
Why Choose Our Data Analytics Training in Whitefield?
- Why Scholar Logic
- Expert Trainers - Real-time industry experts
- Personalised Learning - 1:1 mentorship + doubt clearing + practice sessions
- Small Class Sizes - 10 to 15 Max
- What You Will Learn
- Comprehensive Curriculum – Visualisation + Data tools
- Updated Course Material – Industry-standard syllabus
- Live Tools – Power BI, Tablue, DAX, Excel, SQL, SAS, Python &R
- Hands-On Learning
- Hands-on Learning – Practical labs
- Industry-Relevant Projects – 2–3 real-world projects
- Cloud Deployment Practice – SQL pipelines, Python and R, Visualisation
- Certification & Job Assistance
- AWS Certification Preparation
- Mock Tests + Interview Prep
- Job Assistance – Resume building, interview prep
- Placement Support – Companies you tie-up with
Data Analytics Course Curriculum
Topics to be covered
- Excel: Basics to Advanced
- MySQL
- Tableau
- Power BI
Excel
- Introduction
- MS office Versions(similarities and differences)
- Interface(latest available version)
- Row and Columns
- Keyboard shortcuts for easy navigation
- Data Entry(Fill series)
- Find and Select
- Clear Options
- Ctrl+Enter
- Formatting options(Font,Alignment,Clipboard(copy, paste special))
- Referencing, Named ranges,Uses,Arithemetic Functions
- Mathematical calculations with Cell referencing(Absolute,Relative,Mixed)
- Functions with Name Range
- Arithmetic functions(SUM,SUMIF,SUMIFS,COUNT,COUNTA,COUNTIFS,AVERAGE,AVERAGEIFS,MAX,MAXIFS,MIN,MINIFS)
- Logical functions
- Logical functions:IF,AND,OR,NESTED IFS,NOT,IFERROR
- Usage of Mathematical and Logical functions nested together
- Referring data from different tables: Various types of Lookup, Nested IF
- LOOKUP
- VLOOKUP
- NESTED VLOOKUP
- HLOOKUP
- INDEX
- INDEX WITH MATCH FUNCTION
- INDIRECT
- OFFSET
- Advanced functions
- Combination of Arithmatic
- Logical
- Lookup functions
- Data Validation(with Dependent drop down)
- Date and Text Functions
- Date Functions:DATE,DAY,MONTH,YEAR,YEARFRAC,DATEDIFF,EOMONTH
- Text Functions:TEXT,UPPER,LOWER,PROPER,LEFT,RIGHT,SEARCH,FIND,MID,TTC, Flash Fill
- Data Handling::Data cleaning, Data type identification, Remove Duplicates, Formatting and Filtering
- Number Formatting(with shortcuts)
- CTRL+T(Converting into an Excel Table)
- Formatting Table
- Remove Duplicate
- SORT
- Advanced Sort
- FILTER
- Advanced Filter
- Data Visualization: Conditional Formatting, Charts
- Conditional formatting(icon sets/Highlighted colour sets/Data bars/custom formatting)
- Charts:Bar,Column,Lines,Scatter,Combo,Gantt,Waterfall,pie
- Data Summarization: Pivot Report and Charts
- Pivot Reports:Insert,Interface,Crosstable Reports;Filter,Pivot Charts,
- Slicers:Add,Connect to multiple reports and charts
- Calculated field, Calculated item
- Data Summarization: Dashboard Creation, Tips and Tricks
- Dashboard:Types,Getting reports and charts together, Use of Slicers.
- Design and placement: Formatting of Tables,Charts,Sheets,Proper use of Colours and Shapes
- Connecting to Data: Power Query, Pivot, Power Pivot within Excel
- Power Query: Interface, Tabs
- Connecting to data from other excel files, text files, other sources
- Data Cleaning
- Transforming
- Loading Data into Excel Query
- Connecting to Data: Power Query, Pivot, Power Pivot within Excel
- Using Loaded queries
- Merge and Append
- Insert Power Pivot
- Similarities and Differences in Pivot and Power Pivot reporting
- Getting data from databases, workbooks, webpages
- VBA and Macros
- View Tab
- Add Developer Tab
- Record Macro:Name,Storage
- Record Macro to Format table(Absolute Ref)
- Format table of any size(Relative ref)
- Play macro by button
- shape
- as command(in new tab)
- Editing Macros
- VBA:Introduction to the basics of working with VBA for Excel: Subs, Ranges, Sheets
- Comparing values and conditions
- if statements and select cases
- Repeat processes with For loops and Do While or Do Until Loops
- Communicate with the end-user with message boxes and take user input with input boxes, User Form
MySQL
- Introduction to Mysql
- Introduction to Databases
- Introduction to RDBMS
- Explain RDBMS through normalization
- Different types of RDBMS
- Software Installation(MySQL Workbench)
- SQL Commands and Data Types
- Types of SQL Commands (DDL,DML,DQL,DCL,TCL) and their applications
- Data Types in SQL (Numeric, Char, Datetime)
- DQL & Operators
- SELECT
- LIMIT
- DISTINCT
- WHERE AND
- OR
- IN
- NOT IN
- BETWEEN
- EXIST
- ISNULL
- IS NOT NULL
- Wild Cards
- ORDER BY
- Case When Then and Handling NULL Values
- Usage of Case When then to solve logical problems and handling NULL Values (IFNULL, COALESCE)
- Group Operations & Aggregate Functions
- Group By
- Having Clause
- COUNT
- SUM
- AVG
- MIN
- MAX
- COUNT String Functions
- Date & Time Function
- Constraints
- NOT NULL
- UNIQUE
- CHECK
- DEFAULT
- Primary key
- Foreign Key (Both at column level and table level)
- Joins
- Inner
- Left
- Right
- Cross
- Self Joins
- Full outer join
- DDL
- Create
- Drop
- Alter
- Rename
- Truncate
- Modify
- Comment
- DML & TCL Commands
- DML
- Insert
- Update & Delete
- TCL
- Commit
- Rollback
- Savepoint
- Data Partitioning
- DML
- Indexes and Views
- Indexes (Different Type of Indexes)
- Views in SQL
- Stored Procedures
- Procedure with IN Parameter
- Procedure with OUT parameter
- Procedure with INOUT parameter
- Function, Constructs
- User Define Function
- Window Functions
- Rank
- Dense Rank
- Lead
- Lag
- Row_number
- Union, Intersect, Sub-query
- Union, Union all
- Intersect
- Sub Queries, Multiple Query
- Exception Handling
- Handling Exceptions in a query
- CONTINUE Handler
- EXIT handler
- Triggers
- Triggers – Before | After DML Statement
Tableau
- Introduction to Tableau
- What is Tableau ?
- What is Data Visulaization ?
- Tableau Products
- Tableau Desktop Variations
- Tableau File Extensions
- Data Types, Dimensions, Measures, Aggregation concept
- Tableau Desktop Installation
- Data Source Overview
- Live Vs Extract
- Basic Charts & Formatting
- Overview of worksheet sections
- Shelves
- Bar Chart, Stacked Bar Chart
- Discrete & Continuous Line Charts
- Symbol Map & Filled Map
- Text Table, Highlight Table
- Formatting: Remove grid lines, hiding the axes, conversion of numbers to thousands, millions, Shading, Row divider, Column divider
- Marks Card
- Filters
- What are Filters ?
- Types of Filters
- Extract, Data Source, Context, Dimension, Measure, Quick Filters
- Order of operation of filters
- Cascading
- Apply to Worksheets
- Calculations
- Need for calculations
- Types: Basic, LOD’s, Table
- Examples of Basic Calculations: Aggregate functions, Logical functions, String functions, Tablea calculation functions, numerical functions, Date functions
- LOD’s: Examples
- Table Calculations: Examples
- Data Combining Techniques
- What is Data Combining Techniques ?
- Types
- Joins, Relationships, Blending & Union
- Custom Charts
- Dual Axis
- Combined Axis
- Donut Chart
- Lollipop Chart
- KPI Cards (Simple)
- KPI Cards (With Shape)
- Groups, Bins, Hierarchies, Sets, Parameters
- What are Groups ? Purpose
- What are Bins ? Purpose
- What are Hierarchies ? Purpose
- What are Sets ? Purpose
- What are Parameters ? Purpose and examples
- Analytics & Dashboard
- Reference Lines
- Trend Line
- Overview of Dashboard: Tiled Vs Floating
- All Objects overview, Layout overview
- Dashboard creation with formatting
- Dashboard Actions & Tableau Public
- Actions: Filter, Highlight, URL, Sheet, Parameter, Set
- How to save the workbook to Tableau Public website ?
Power BI
- Power BI Introduction and Installation
- Understanding Power BI Background
- Installation of Power BI and check list for perfect installation
- Formatting and Setting prerequisits
- Understanding the difference between Power BI desktop & Power Query
- The Power BI user interface, including types of data sources and visualizations
- Getting familiar with the interface BI Query & Desktop
- Understanding type of Visualisation
- Loading data from multiple sources
- Data type and the type of default chart on drag drop.
- Geo location Map integration
- Sample dashboard with Animation Visual
- Finanical sample data in Power BI
- Preparing sample dashboard as get started
- Map visual Types and usages in different variation
- Understanding scatter Plot chart with Play axis and the parameters
- Power BI artificial intelligence Visual
- Understanding the use of AI in power BI
- AI analysis in power bi using chart
- Q&A chat bot and the use in real life
- Hirarchy tree
- Power BI Visualization
- Understanding Column Chart
- Understanding Line Chart
- Implementation of Conditional formating
- Implementation of Formating techniques
- Power Query Editor
- Loading data from folder
- Understanding Power Query in detail
- Promote header, Split to limiter, Add columns, append, merge queries etc
- Modelling with Power BI
- Loading multiple data from different format
- Understanding modelling (How to create relationship)
- Connection type, Data cardinality, Filter direction
- Making dashboard using new loaded data
- Power Query Editor Filter Data
- Power Query Custom Column & Conditional Column
- Manage Parameter
- Introduction to Filter and types of filter
- Trend analysis, Future forecast
- Customize the data in Power BI
- Understanding Tool tip with information
- Use and understanding of Drill Down
- Visual interaction and customisation of visual interaction
- Drill through function and usage
- Button triggers
- Bookmark and different use and implementation
- Navigation buttons
- Dax Expressions
- Introduction to DAX
- Table Dax, Calculated column, DAX measure and difference
- Eg:- Calendar, Calendar auto, Summarize, Group by etc
- Calculated Column
- Related, Lookup value, switch, Datedif,Rankx,Date functions
- Dax Measure and Quick Measure
- Remove filters, Keep filters, All, Allselected, Time Intelligence Functions,Rolling average,YoY, Running total
- Custom Visual
- Custom visual and understanding the use of custom
- Loading custom visual, Pinning visual
- Loading to template for future use
- Publishinhg Power Bi
- Power BI Service
- Introduction to app.powerbi.com
- Schedule refresh
- Data flow and use power bi from online
- Download data as live in power point and more
Data Analytics Certificate Course In Whitefield
Industry-Recognized Certification:
After completing this program, you will receive a well-respected Data Analytics Certificate that is valued across the tech and business industries. This certification highlights your analytical skills, practical project experience.
Strong Certification Credibility:
Our Data Analytics Certification carries genuine weight in the job market. It showcases your commitment to learning, the hands-on training you’ve undergone, and the practical knowledge you’ve built throughout the course.
Global Acceptance:
The Data Analytics Certificate you earn from us is recognized by companies not just in India, but internationally as well. This gives you the flexibility to explore opportunities in diverse industries.
High Market Demand:
Data Analytics professionals are in extremely high demand, and the skills you gain in this program align with what companies are actively hiring for.
Boosts Career Growth:
Students who complete this certification often see faster career growth, whether they are starting their career or switching fields.
Why Scholar Logic?
Compare us with other training institutes in Whitefield
Program Highlights
Top-Notch Faculty
Trainers at Scholarlogic are passionate about training, and carry 10+ years of industry experience.
Exhaustive Course Curriculum
Our industry-relevant course curriculum is tailored to provide practical exposure with the theory.
Real-life Projects and Bootcamps
Learners will work on real-life data analytics scenarios from various domains to get application knowledge.
Job Readiness Program
Intensive interview preparation from Day 1 to prepare candidates for interviews with our network of 2000+ hiring partners.
Skills Covered
Tools & Technologies Covered
Who Should Do The Data Analyst Course
Learning Path
Why ScholarLogic?
Experienced Faculty
Work Hands-on with 2+ Real Life Projects
Dedicated Placement cell for 100% Placement Assistance
Dedicated Case studies support team
24/7 Trainer Whatsapp Support
Lifetime eLearning access
Contact Our Team of Experts


From Learning to Earning Real Students Journey
What Our Students Have To Say about Us

ScholarLogic’s DevOps training provided clear insights into pipelines. The real-time tasks and mentor guidance quickly built my confidence and prepared me for the job.
Narayana Swamy
Student
The Python course was straightforward, practical, and well-organized. The hands-on exercises enhanced my coding skills and effectively prepared me for interviews.
David S
Student
AWS sessions were productive and focused on real projects. The trainer explained cloud concepts clearly, making complex topics easy to understand.
Dipen Bhangale
Student
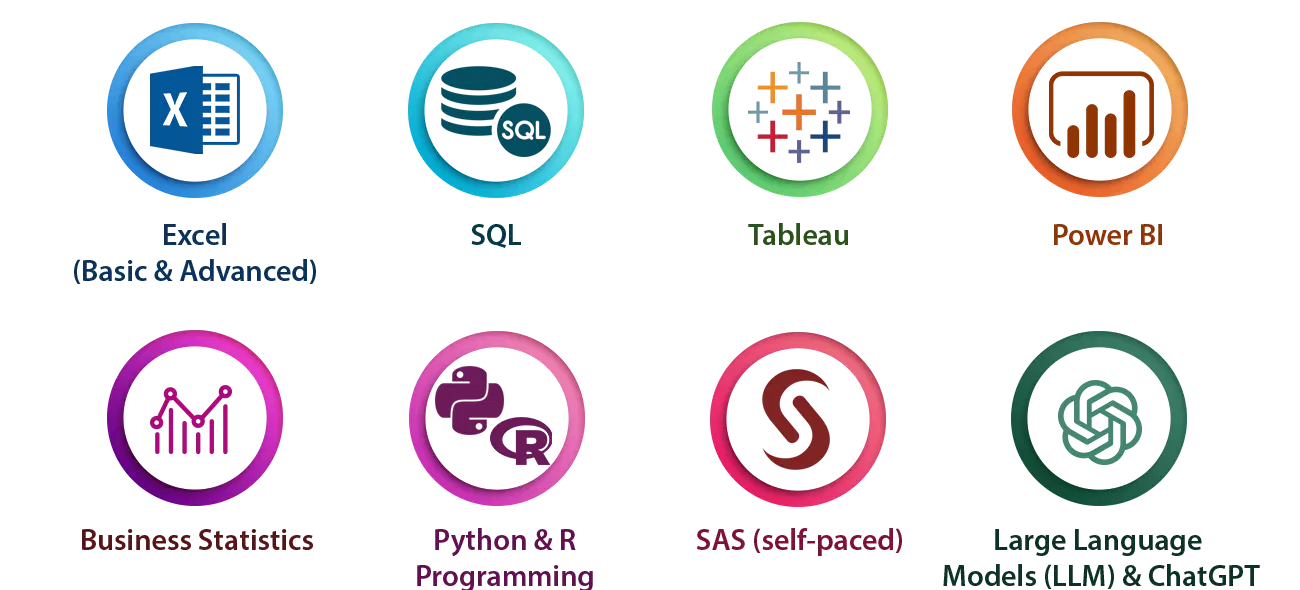
Data analytics training covered SQL, Power BI, and Excel using real datasets. I gained confidence through practice labs and received strong placement support.
Harshith Vasanth
Student
The Java course effectively covered both basic and advanced concepts. Real-world examples and project guidance enabled me to master coding and approach interviews with confidence.
Rohit Gurjar
Student
The Front-End Development course at ScholarLogic was outstanding. The curriculum was up-to-date with the latest technologies, and the trainers made learning enjoyable. The projects were challenging but rewarding and the placement support was very effective.
Jidnyesh Sachin Patil
Student
ScholarLogic’s DevOps course provided an excellent foundation for my career. The trainers were experts in the field, and the course content was up-to-date and relevant. The placement support was effective, and I was able to secure a job shortly after completing the course.
Golu Tekade
Student
Scholarlogic is best for learning it field and teaching was excellent and I have learned Devops and this institute helpful for students ,it is overall good experience for me, the way of teaching and solving doubts and guiding me was good😊
Veeresh
Student
The way of teaching is so good for me the teaching is so clean and neat easily understood. They help me clear all my doubts anyway it is a good experience in my life Like
Brijesh
Student
I recently completed a course at ScholarLogic Training Institute, and I must say, it exceeded all my expectations. From start to finish, the experience was nothing short of exceptional.
Dayanand
Student
"Fantastic coaching classes! Great instructors, and personalized attention. Highly recommend!" Thank you Scholarlogic
Shrivathsa M
Student
I have completed my cloud computing course recently I had good experience in scholar logic and the trainers are very friendly.
Pandurang Hundekar
StudentFAQs
What are the prerequisities for this python course?
- As such, there is no prerequisite for undertaking this training. However, it is highly desirable if you possess the following skills sets
- Analytical expertise
- Good critical thinking and problem-solving skills
- Communication Skills
What Are The Career Opportunities For Data Analyst Professionals?
- Data Analyst has become the spine around which crucial company decisions are made. Organisations are paying top dollars to recruit Data Analyst professionals and the demand is only going to increase with the influx of data from new sources. The career roles that you can cherry pick are
- Data Analyst
- Research Analyst
- PMO
- Business Analyst Consultant / Manager
- Data Analyst In Various Domains/ Functions eg: Banking, Health Care, Retail, Telecom, e-Commerce, Marketing, Sales, HR & Finance.
What Kind Of Salary Can I Expect As A Data Analyst Professional?
- Just as the saying goes – You reap what you sow, your experience plays an important factor in determining the package that you will be offered
- Entry Level – 3.5 to 4.5 Lakhs PA
- Intermediate Level – 4.5 to 8.5 Lakhs PA
- Experienced Level – 10 to 16 Lakhs PA
- Advanced Level – 17 to 25 Lakhs PA
I am from one of the departments of Sales/Marketing/Diploma/HR/Finance. Is Data Analyst Course Suitable for me ?
- The companies in the above domains are generating huge amounts of data which requires a specialist to analyse and generate insights from this data & that requires some amount of functional knowledge from the above departments. For eg: Data from Sales Dept can be analysed efficiently by a data analyst who has sound knowledge on sales.
I am A Fresher/ Recently Graduated. Is Data Analyst Course Suitable for me ?
- Data Analyst helps a Data Scientist in the execution of Data Science Projects by extracting data from SQL and cleaning the data using various tools, before it can be passed onto a Data Scientist. When the data analyst gets promoted they become Data Scientists.
So, Data Scientists would build the machine learning algorithms using Python. Ultimately, the data that has been received from Data Analysts.
Data Analyst and Data Scientist jobs are of the stream, but the level of difficulty and skillset would vary as stated above. But both the roles have a great upskilling value in today’s job market.
What is the difference between Data Scientist & Data Analyst ?
- Instructor-led online training is an interactive mode of training where participants and trainer will log in at the same time and live sessions will be done virtually. These sessions will provide scope for active interaction between you and the trainer.
What Is Instructor-Led Online Training?
- It is a live instructor-led interactive session which is done at a specific time where participants and trainer will log in at the same time. The same session will be also recorded and access will be provided to revise, recap or watch any missed session.
How Many Batches Can I Attend, If Enrolled For Training?
- ScholarLogic offers a blended model of learning. In this model participants, can attend classroom, instructor-led live online and e-learning (recorded sessions) with a single enrolment. A combination of these 3 will produce a synergistic impact on the learning. One can attend multiple Instructor-led live online sessions for one year from different trainers at no additional cost.
Is This A Live Training Or Recorded Sessions?
- The training is a live instructor-led interactive session done at a specific time where participants and trainer will log in at the same time. The same session will be also recorded and access will be provided to revise, recap or watch a missed session.
Whom Should I Contact If I Want to Know More Information About The Training?
You can reach out to us by visiting our website https://scholarlogic.net/ and interact with our live chat support team. Our customer service representatives will assist you with all your queries. You can also send us an email at info@scholarlogic.net with your query and our Subject Matter Experts / Sales Team will clarify your queries or call us on 7892393639
What If I Miss A Live Session?
- Not a problem even if you miss a live Data Science session for some reason. Every session will be recorded and access will be given to all the videos on ScholarLogic state-of-the-art Learning Management System (LMS). You can watch the recorded Data Science sessions at your own pace and convenience.
Will I Get A Data Analyst Course Completion Certification From ScholarLogic?
- Yes, after successfully completing the course you will be awarded a course completion certificate from ScholarLogic.
What Are The Different Modes Of Payment Available?
The different payment methods accepted by us are
- Cash
- Net Banking
- Cheque
- Debit Card
- Credit Card