


Best software training institute in Bangalore with best teaching from experts, I love way of teaching and behavior with students
Narayana Swamy
Student
I wanted to learn Salesforce courses in Bangalore offline. I was searching for best institutes for months... Since I'm working in a MNC in Oracle support job, I want to change into IT. When enquired, they said they have early morning and evening batches for working professionals.. So I joined here... They teach practically. With that knowledge I applied for jobs with 2 years experience. Now I'm working at kasmo technology company. Thanks 🙏 highly recommended
David S
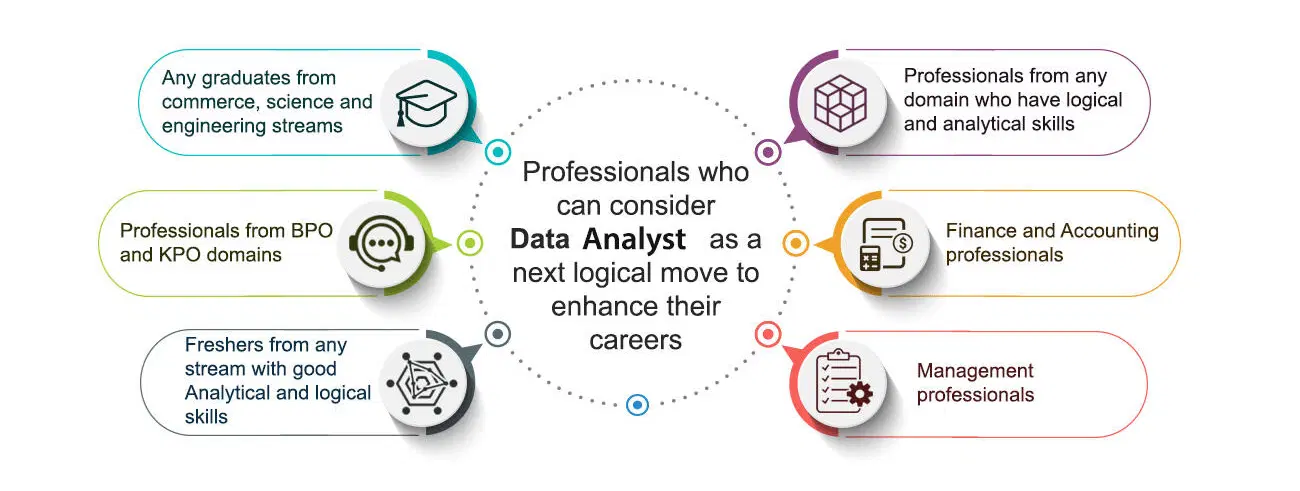
StudentI enrolled in the Data Analytics course at ScholarLogic, and I’m very satisfied with the experience. The course was well-structured, and the instructors were always available to clarify doubts. The practical assignments were very helpful, and the placement assistance helped me find a job in a reputable company.
Dipen Bhangale
StudentScholarLogic provided excellent training. The instructors were knowledgeable and always ready to help. The hands-on labs were particularly beneficial in understanding real-world scenarios. Highly recommend their courses.
Harshitha Vasanth
Student
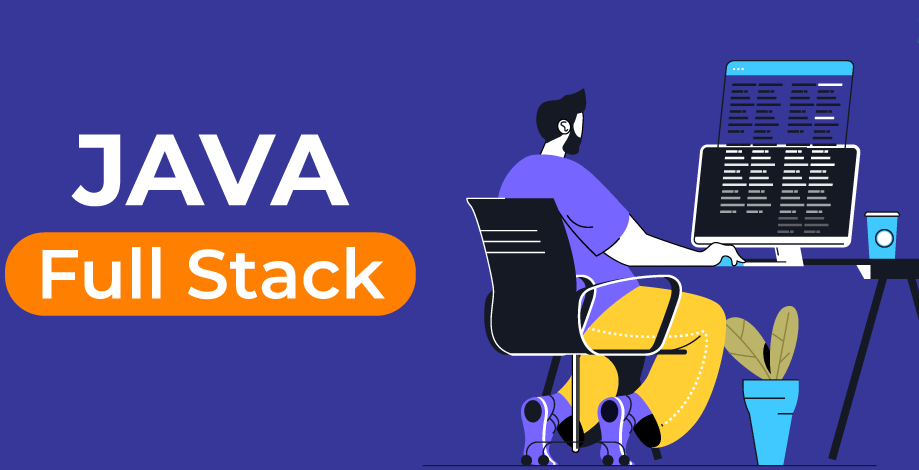
The Python Full Stack course at ScholarLogic was top-notch. The trainers were well-versed in the subject matter and provided a clear understanding of both front-end and back-end development. The projects were challenging but prepared me well for my job, which I secured through their excellent placement assistance.
Rohit Gurjar
Student
The Front-End Development course at ScholarLogic was outstanding. The curriculum was up-to-date with the latest technologies, and the trainers made learning enjoyable. The projects were challenging but rewarding and the placement support was very effective.
Jidnyesh Sachin Patil
StudentScholarLogic’s DevOps course provided an excellent foundation for my career. The trainers were experts in the field, and the course content was up-to-date and relevant. The placement support was effective, and I was able to secure a job shortly after completing the course.
Golu Tekade
Student
Scholarlogic is best for learning it field and teaching was excellent and I have learned Devops and this institute helpful for students ,it is overall good experience for me, the way of teaching and solving doubts and guiding me was good😊
christy
StudentThe way of teaching is so good for me the teaching is so clean and neat easily understood. They help me clear all my doubts anyway it is a good experience in my life Like
Brijesh
Student"Fantastic coaching classes! Great instructors, and personalized attention. Highly recommend!" Thank you Scholarlogic
Shrivathsa M
Student
I have completed my cloud computing course recently I had good experience in scholar logic and the trainers are very friendly.
Pandurang Hundekar
Student